

Product Performance Overview
Google’s Product Performance Report provides valuable insight into how customers are interacting with your products. GA reports with detailed metrics and segmentation capabilities can transform the way you measure product performance and make decisions.
If you understand these metrics and how to utilize them, you can raise your conversion rate and optimize marketing spend.
Why product performance report is important for e-commerce?
The Product Performance Report is the light on how shoppers interact with products which makes it a valuable tool for tweaking your product offerings and maximizing conversions.
Here are some benefits:
- You can find out which products have the highest number of removes from carts and build promotions around them to nudge customers toward an actual conversion.
- Using Quantity metric: you can know the products that are selling the most in terms of quantity, which also helps you in determining the quantities that you want to provide for each product to meet the customer’s needs.
- Using the buy-to-detail rate metric, figure out if low numbers are related to poor product description copy and try different tactics, by giving more clear and sufficient information about the product to motivate the customer to buy.
Google Analytics product performance report explanation
The Product Performance Report in Google Analytics explains the sales performance and shopping behavior during a specific time period. This report is useful for merchandisers to see how much revenue each product has made, which products are their bestsellers, and which products are underperforming. These statistics can also help determine which marketing campaigns are performing well and which need improvement.
You can find the Product Performance Report in the Ecommerce Conversions menu:
Conversions > E-commerce > Product Performance.
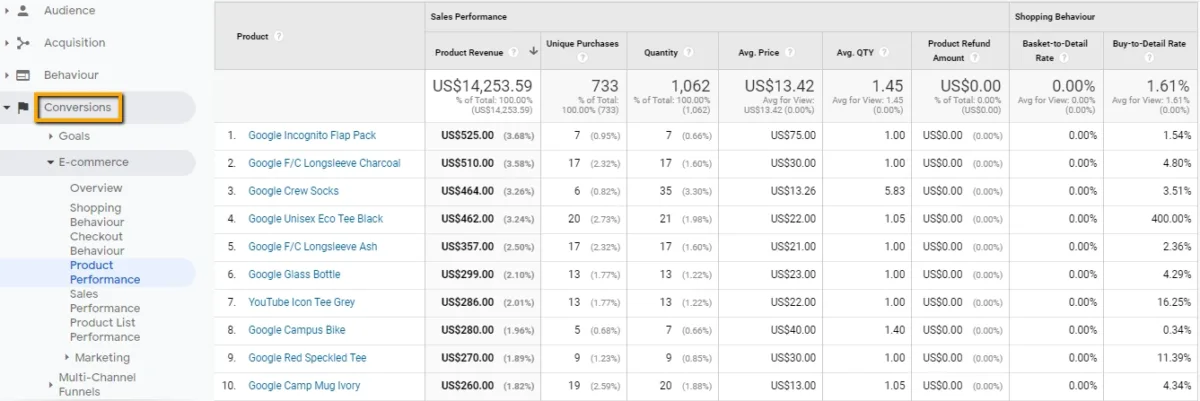
The Product Performance Report provides a ton of useful information for your eCommerce site.
Now we will describe some of the key data that is included in this report, and how you can use it.
Note: The report has two tabs that display two different views
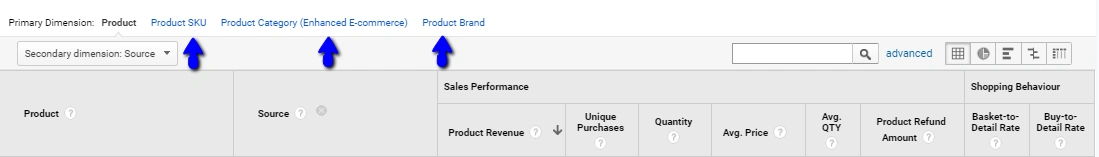
The First Tab: Summary Report.
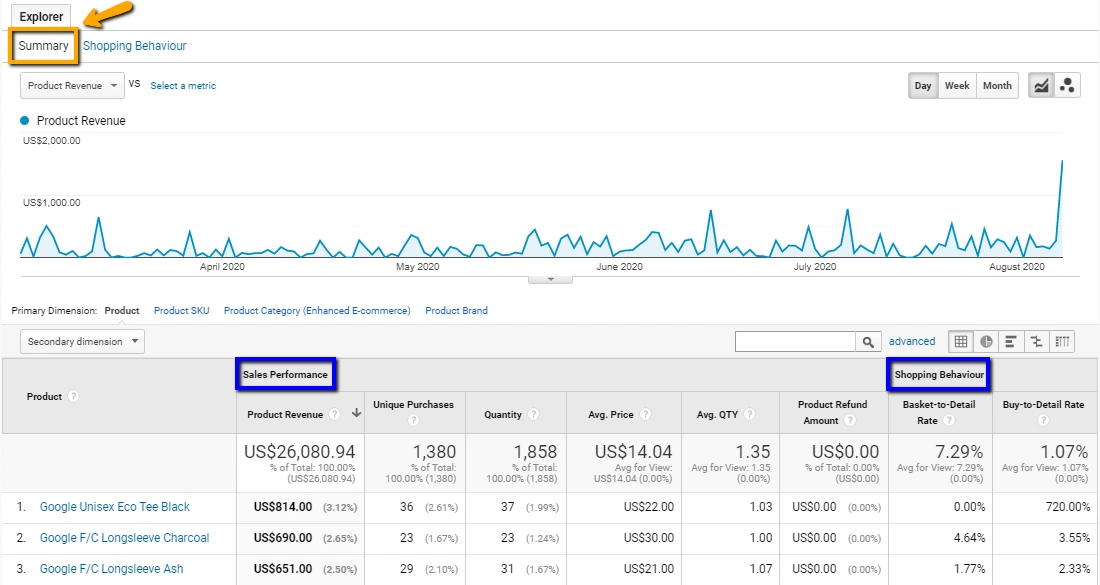
In this report we note the metrics are divided into two parts according to Google Analytics:
Sales Performance Metrics:
- Product Revenue: This is the total amount of revenue earned from the specific product during the selected time period.
- Unique Purchases: This is the total number of transactions involving the specific product during the selected time period.
- Quantity: This is the quantity of product sold during the selected time period.
- Average price: This is the average price per sale (i.e. revenue divided by quantity) during the selected time period.
- The average quantity: This is the average number of items per transaction (i.e. quantity divided by unique purchases) during the selected time period.
- Product refund amount: If you pass your refund events into Google Analytics, this column shows you the total revenue refunded during the selected time period.
Shopping Behaviour Metrics:
Let you know which products are up/down in the sales funnel. It’s useful when you suspect that some products are more likely to be abandoned throughout the sale than others; This can be useful in determining how effective a product page is.
- Cart-to-detail rate: This is the percentage of product page views that led to the product being added to the shopping cart. (AddToCart / PDP views)
- Buy-to-detail Rate: This is the percentage of product page views that led to the product being purchased. (Unique Product Purchases / PDP views)
The second tab: Shopping Behaviour
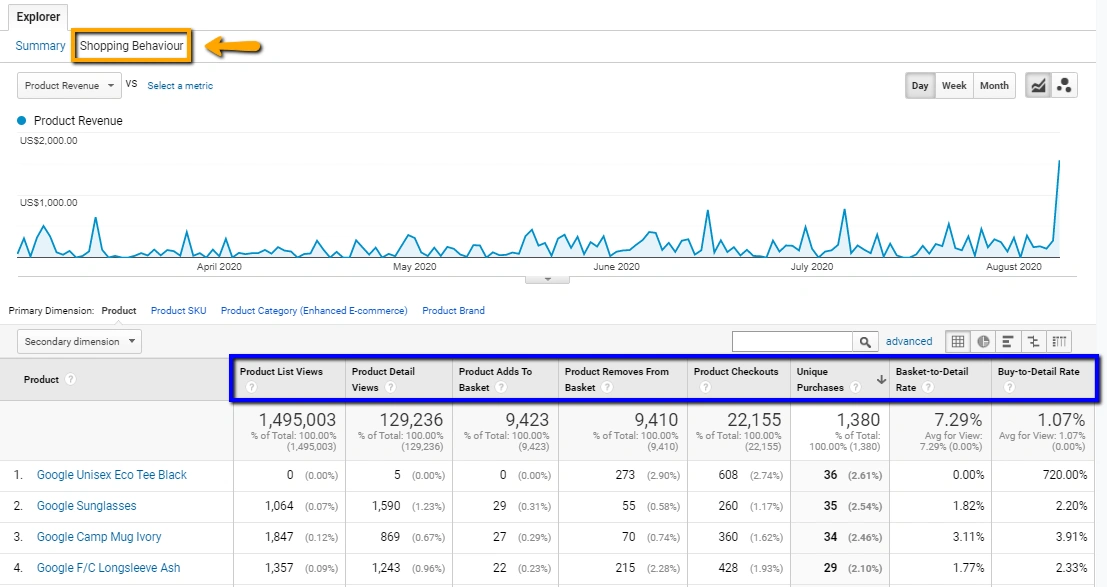
In this report, it shows you different metrics from the previous summary report.
Product List Views: This is the number of times the product appeared in the product list during the specified time period. Product listing views include navigating to specific shopping categories, search results, or any other lists across the website.
Product Detail Views: This is the number of times that the product has been looked at individually during the time period selected. (PDP views)
Product Adds to Cart: This is the number of times that the product has been added to a cart during the selected time period.
Product Removes From Cart: This is the number of times that the product has been removed from a shopping cart during the selected time period.
Product Checkouts: This is the number of times that a particular product has been included in a shopping cart at the time that the visitor entered the checkout process.
Unique Purchases: Similar to Unique Purchases in the Summary report.
Cart-to-Detail Rate: Similar to Cart-to-Detail Rate in the Summary report.
Buy-to-Detail Rate: Similar to Buy-to-Detail Rate in the Summary report.
You can also add a relevant secondary dimension to this report from the Dimensions Options menu. The Secondary Dimension feature allows you to define a primary dimension and then view that data by a secondary dimension within the same table which makes you analyze data more deeply.
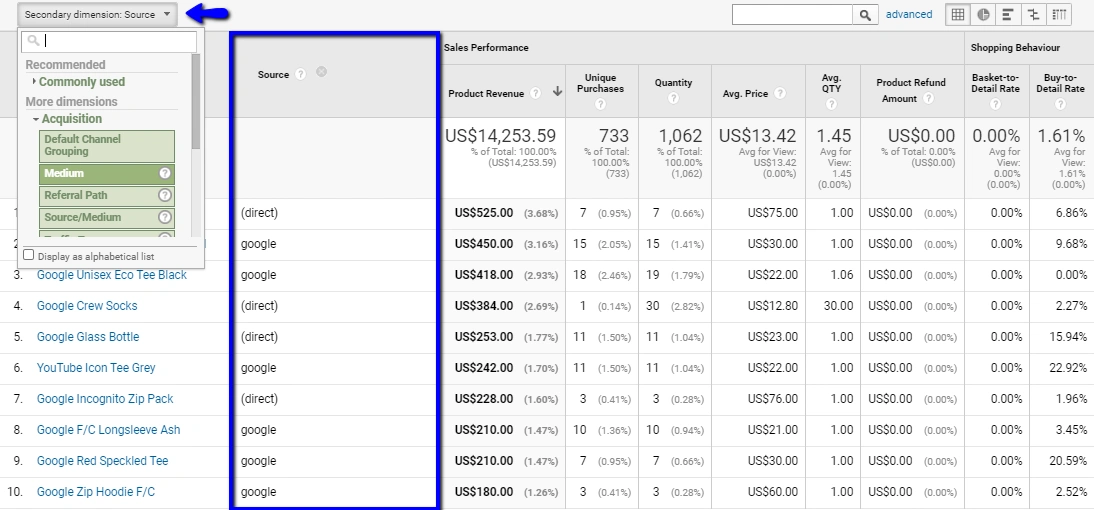
Moreover, you can switch the view to use one of the following primary dimensions: Product Name, Product ID (SKU), Product Category, or Product Brand.
How to boost product performance
You can boost your product performance with Google Analytics as follow:
- Focus on one product each time.
- Understand all related metrics.
- Compare the metrics to one of the high-performing products in your store.
- Use secondary dimensions to dive into the product details, seeking patterns or similarities.
- Use segments to better understand the other characteristics such as demographics, marketing channels, and campaigns.
- Test & keep monitoring the new results.
Our Data Analytics Expertise
Daam Al-Arabia is the leading Data Analytics agency in the Kingdom of Saudi Arabia. With over a decade of industry expertise, we have had fruitful partnerships with some of the Kingdom’s largest companies across various industries. Here’s an overview of our areas of excellence.
Our Data Analytics Guarantees
Quick, Easy Integration
Connect all your touchpoints and let the magic unfold.
Seamless Onboarding
Work with our specialists for an easy onboarding experience.
Immediate Impact
Get immediate and long term results from the go-live date.
SpeedyPlus Support
Receive expert technical support within 2 business hours.
Our Data Analytics Tech Stack
")

")
Send Us A Message
Quick Contact
Quick Contact
Trusted by some of the biggest companies in the Kingdom


