
Shopping Behavior Analysis

Introduction
Many e-commerce companies strive to achieve the best customer experience within their websites or mobile apps, however, 75% “almost 8 out of 10” of online shopping carts are abandoned without the purchase being completed. Deficient checkout processes are often singled out as the main cause, but many other problems faced by e-commerce users could be behind it.

For example:
- Scarce product information on the product detail page.
- Poor logistics and long delivery time.
- Slowness in pages load time.
- Account login or verification issues.
- Selecting the delivery location on the map.
And many other problems that the customer may face.
The most important question is how can we know the problems facing clients on the site?
The simple answer is “Google Analytics”
A free tracking tool offered by Google, and it shows how visitors use your website/mobile app, and what kinds of problems they're facing?

In this article, we will talk about one of the reports that Google Analytics provides, it is the Shopping Behavior Report that can answer all the questions above.
What is shopping behavior for e-commerce?
The shopping behavior is the customer's journey inside the online store.
For online retailers, data collection is probably the most important business asset.
Through behavioral data analysis, eCommerce stores can extract insights about the visitor’s interactions using Google Analytics shopping behavior reports. It enables them to know in which step the visitor encountered a problem that prevented him to complete his purchase. As a result, e-commerce owners will achieve more conversions without spending more on marketing campaigns.

The key benefits of shopping behavior report:
- Lets you monitor the number of sessions that included each stage of your purchase funnel.
- How many sessions continued from one step to the next, and how many abandoned the funnel at each stage.
- Helps you identify which pages in the shopping process have high abandonment rates and need improvement.
- You can re-target customers who abandon their shopping cart by creating a segment for people who didn’t complete the purchase step via Google Ads.
Now after you know the benefits of shopping behavior, let’s dive into:
key metrics of the report:
To analyze your customers’ shopping behavior, go to the Shopping Behavior report in Google Analytics.
You can find this report under Conversions > Ecommerce > Shopping Behavior
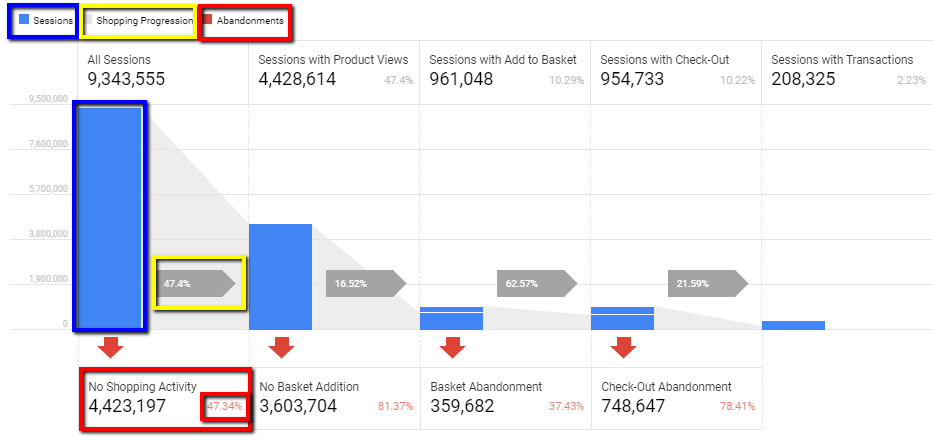
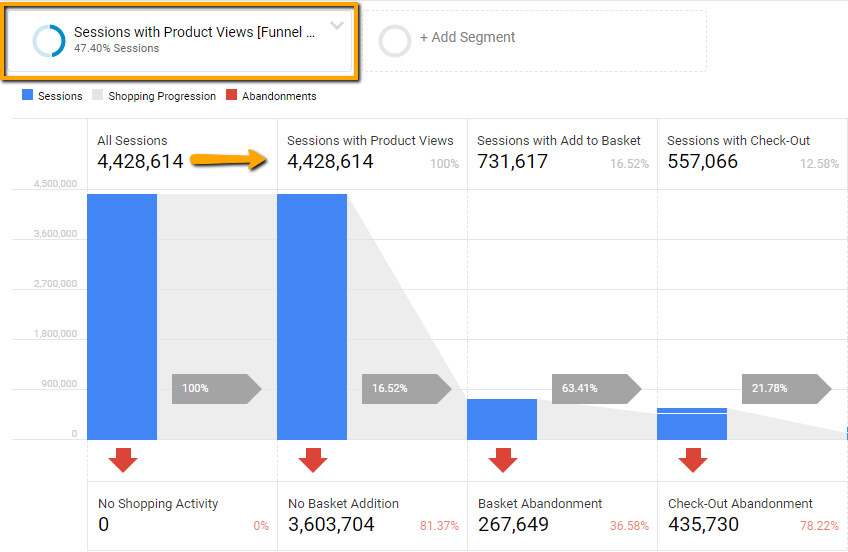
. The “Blue” color reveals all sessions that entered at each stage.
. The Shopping Progression percentage is calculated by dividing Sessions with Action by All Sessions.
. The Abandonments percentage is calculated by dividing Sessions with "No Next Step Activity" / All Sessions entered the concerned step.
Further, you can see how many sessions entered each step directly:
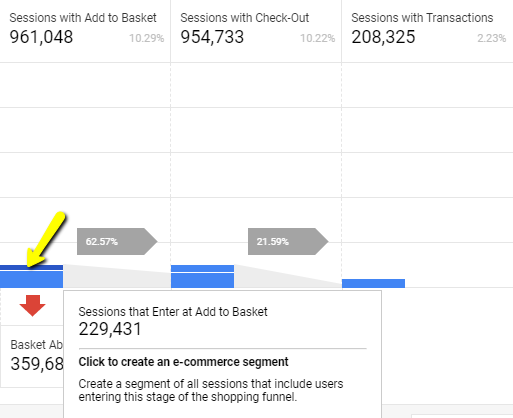
The raw data table under the funnel gives more details:
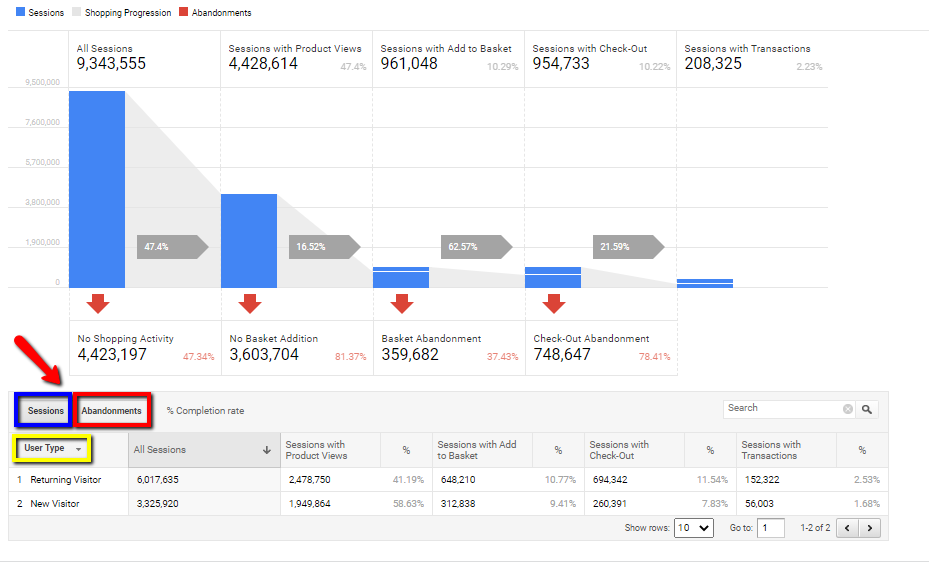
You can change the dimension to see how the numbers changed the default is “User Type”
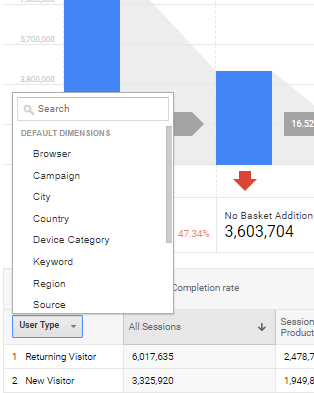
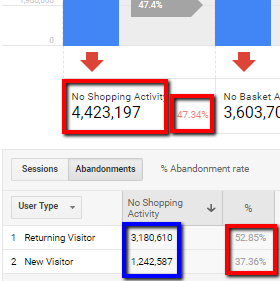
Or you can see the abandonment numbers according to the selected dimension:
How to create funnel segments?
Step 1: Open the Shopping Behavior report and hover one of the funnel steps.
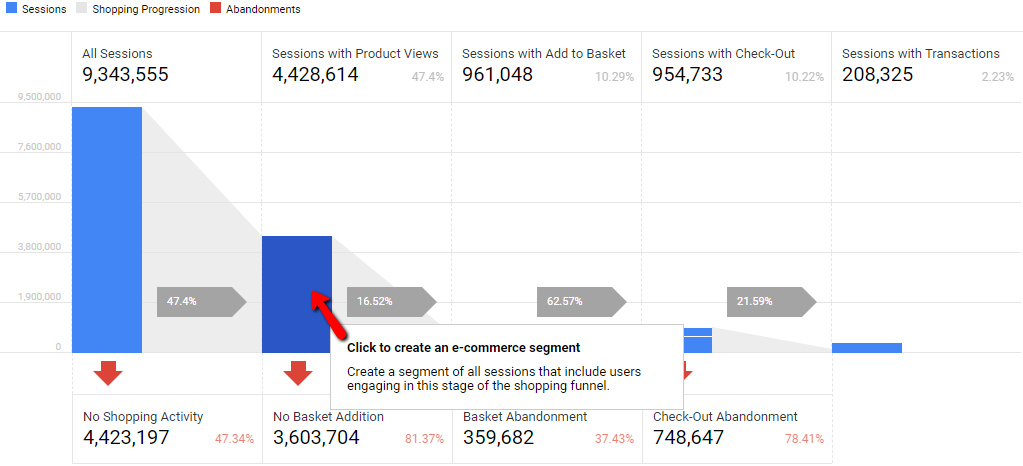
Step 2: Click on the blue bar (or red arrow for abandonment) of the concerned step to open the “create e-commerce segment” popup.
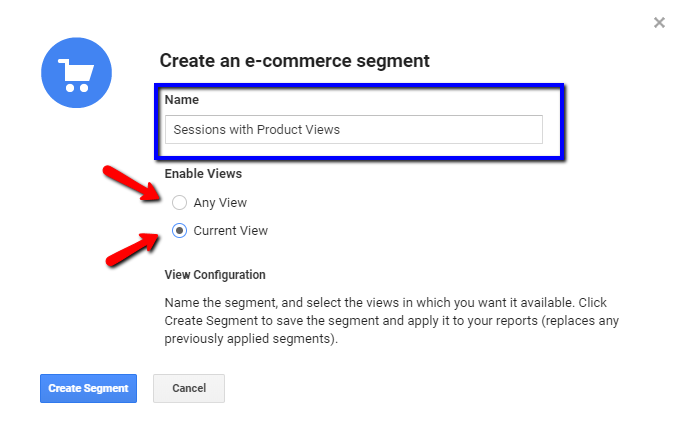
You can rename the segment if you like
Step 3: review the segment after you have created it.
Now, you can keep this segment selected, and see other reports that give you more details about the created segment i.e. demographic, location, browsers, and OS.
Finally, if you integrate “Google Ads” with Google Analytics, you will see this segment immediately within the Google Ads portal where you can use it for a remarketing campaign.
The Shopping Behavior Analysis (users instead of sessions):
You can create a custom report to see the funnel numbers by users instead of session as follow:
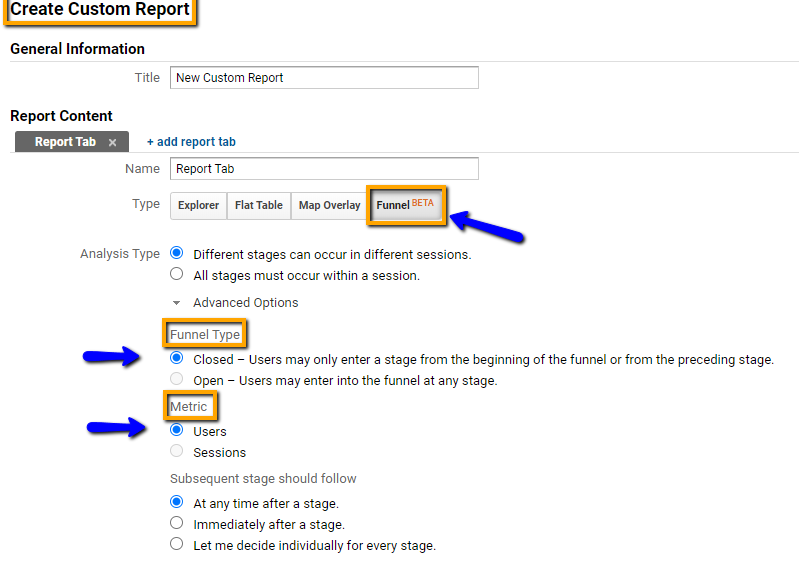
Configure the custom funnels as follow:
Analysis type: “Different stages can occur in different sessions”
Funnel type: Closed
Metric: Users
Subsequent stages should follow: At any time after a stage
The benefits of using users funnel:
Let's get first to know the difference between sessions vs users in Google Analytics:
Users: means the number of unique visitors to your website/app
Essentially, these are the actual people landing on your website, which means that if someone visited your website 10 times using the same device or browser, they would be counted as only one user.
Sessions: defined as the total number of visits to your website/app. So that same person visited your site 10 times on the same device, it will counted 10 sessions.
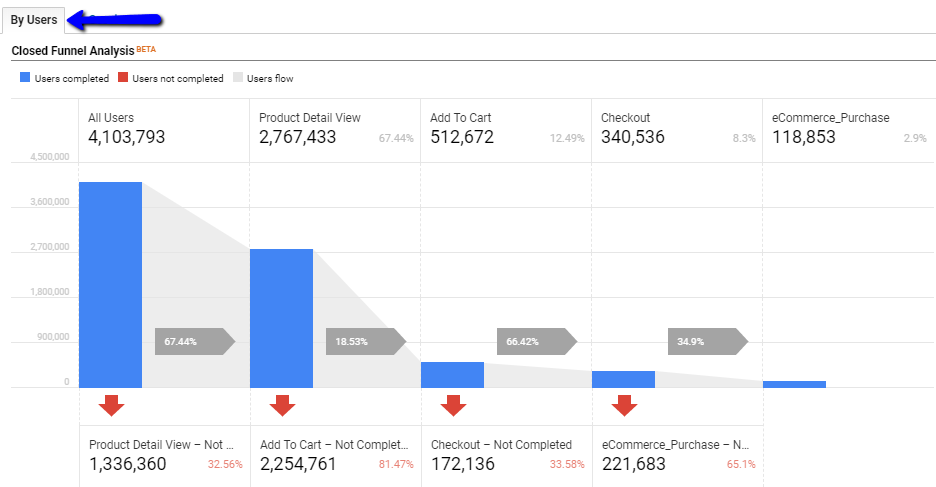
Users’ funnel allows you to see the actual number of visitors who entered each step at a specific time and they completed the journey and placed an order in a different session.
Users’ funnel is very important for eCommerce who provides products that need a longer time to make the purchase decision.
"Da'am Al-Arabia" Can Help!
Apply The Best Analytics Technique
Firebase Analytics for Mobile Apps
Manage Google Analytics 360 Suite
Conversion Rate Optimization (CRO)
Reporting and recommendation services
Data Analysis & Virtualization Service
Enhanced e-Commerce Tracking
Daam Al-Arabia
Our Experts Always Here to Help You.